Forecast Times
Each forecast image consists of three panels. Across the top of the right hand panel is a title bar:

The "GFS Valid:" field on the left side gives
the 24-hour time span for which the plotted data are valid. Times are
given in Mean Greenwich Time ("Z"). To convert to local time,
use these approximations:
Local Standard Time = Greenwich Mean Time - (West Longitude/15)
Local Daylight Time = Greenwich Mean Time - (West Longitude/15) + 1
The hour, day, and month on the right indicate the initialization time of the model run. Regional forecasts will be based on either the 00Z or the 12Z GFS model output.
Right Panel
The right panel shows total precipitation accumulation and precipitation type. Since these are global models, small-scale climate regimes like those found in mountainous terrain, or in the vicinity of islands may not be well forecast. Keep this in mind when looking at forecasts in these areas. Longitude and latitude lines are drawn every 5 degrees.
- Precipitation Amount: The
shaded topographic relief and blue ocean of the map background are visible
in the areas where the total accumulated precipitation is less than
0.02 inches (or 1 millimeter.) The shaded contours and intensity of the
colors indicate the total precipitation accumulation for the indicated
24 hour forecast period.
- Contours are in inches for US maps, millimeters for all others.
- Values below 0.02" or 1mm are not shown.
- Contours are at 0.02", 0.1", 0.2" 0.5", 1", 2", 5", and 10" for the US maps, and at 1, 2.5, 5, 12, 25, 50, 125, and 250mm for all others.
- The amounts are liquid water equivalents. For example, 1" of snow means one inch of water in the melted snow. It could mean anywhere from 3-15" of actual snow, depending on how "wet" the snowfall is.
- Precipitation Type: The
legend in the bottom right corner of the panel looks like this:
The color of the stippled overlays indicates the type of precipitation that occured during the 24 accumulation period. Areas with snow are stippled in white, freezing rain is stippled in blue, ice pellets (sleet) are stippled in green, and a mix of freezing rain and ice pellets is stoppled in red. No stippling means only rain. The frozen precipitation types are model-predicted variables. Some areas may experience more than one precip type during the accumulation period, thus the "Mix" and bigger snow dots shat show underneath the other frozen precip types.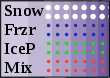
Left Panels
The left panels show shaded contours of the minimum and maximum 2-meter temperatures over the 24-hour forecast period.- Contours are in degrees Fahrenheit on the US maps,
and degrees Celsius on all others.
Contour interval is 4°F, or 2°C - The freezing line is highlighted with a thin black contour.