 |
 |
~ 10-Day Forecast of Global 3-Hourly Precipitation ~

(Click on the image for a larger view or click here for a US-centered domain)
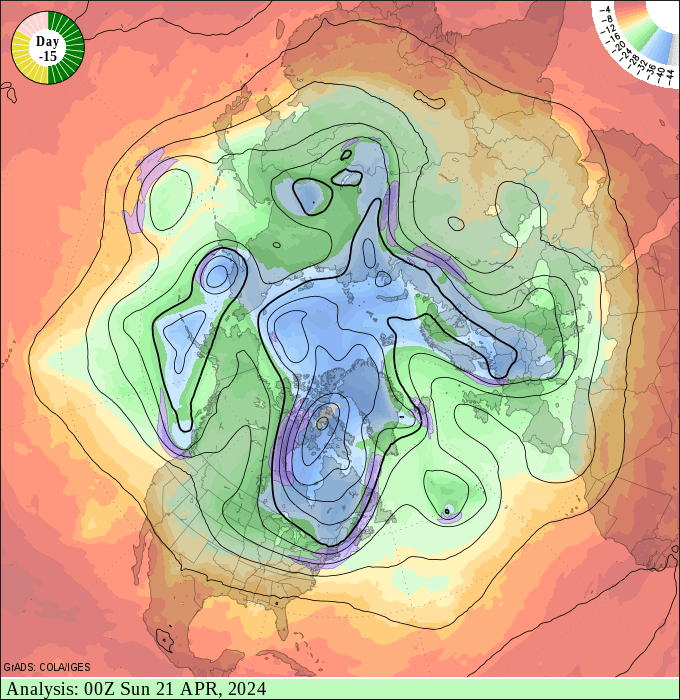
~ The Northern Hemisphere at 500mb ~

This animation shows a sequence of 31 frames representing the state of the 500mb level at 00Z on successive days. The first 15 frames are past analyses, and are denoted by the green segments in the clock in the upper left corner. The midpoint of the animation is at day 0, representing the most recent observed state of the atmosphere, and the start of the current forecast cycle. The next 10 frames (yellow segments in the clock) are from the GFS high-resolution forecast. The final 5 frames (pink segments) are the continuation of the GFS forecast at a coarser resolution.
The colored shading shows the temperatures at 500mb. The black contours show the 500mb geopotential height with a contour interval of 100 meters. The heavy contour is 5400m. The areas highlited with purple are where the 500mb wind speed is greater than 35 m/s. Additional contours for wind speed within the puple areas are for 40, 50, 60, 70, and 80 m/s.
The features tend to "spin" counterclockwise around
the North Pole, reflecting the pervasive west-to-east circulation in
the troposphere.
The rate of motion is considerably slower at low latitudes;
features in the tropics may appear stationary, or even moving clockwise.