 |
 |
~ Meteograms ~
A meteogram is a graphic showing the evolution in time of meteorological data at a fixed location. Several variables are plotted in a meteogram as line graphs, bar graphs, symbols, numbers, or shaded contours. A meteogram illustrates how the variables relate to one another as weather conditions evolve. A brief interpretation guide is here.
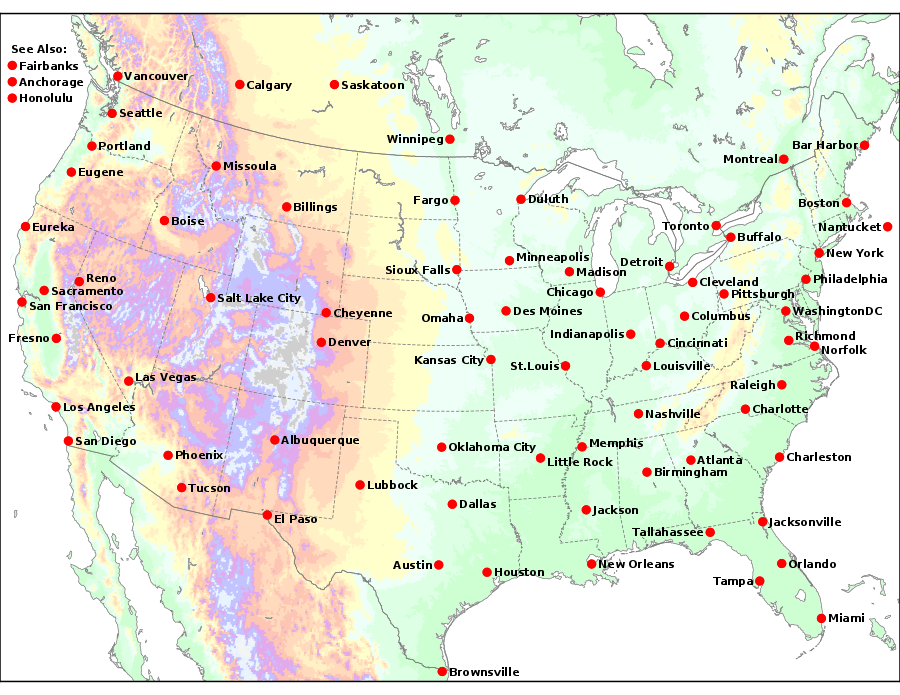
Select one of the preset locations listed below, or Customize a Meteogram for any longitude and latitude.
NAM Day 0-3.5(3-hourly) |
GFS Day 0-10(3-hourly) |
GFS Day 10-16(12-hourly) |
